Watch anywhere.
On multiple devices.


Related Articles

After a dozen editions of Remko on the Rail directly from the actual rail inside at the 2018 World Series of Poker, we continue this series of articles with takes and thoughts using ‘the rail’ as a metaphor for my views on anything current and relevant in the world of poker.
A few years from now, nobody will remember the basis on which a player won individual honors such as the GPI Player of the Year race of the World Series of Poker Player of the Year. People will only remember the winners by name, and recognize them through the banner inside the Amazon room. Because of this, I dove head-first into the World Series of Poker Player of the Year race over the last two years, how the changes to the scoring system made drastic changes to the contenders, how Shaun Deeb’s results in 2018 dwarf the 2017 campaign of Chris Ferguson while the overall results of top performers between the two years are nearly identical.
Quantity Over Quality in 2017
A player can never be at fault for winning a leaderboard of any kind, as all they are responsible for is their own success in a given event. Looking back on the 2017 World Series of Poker, however, makes one thing very clear: The quantity of results was heavily valued over the quality of results.
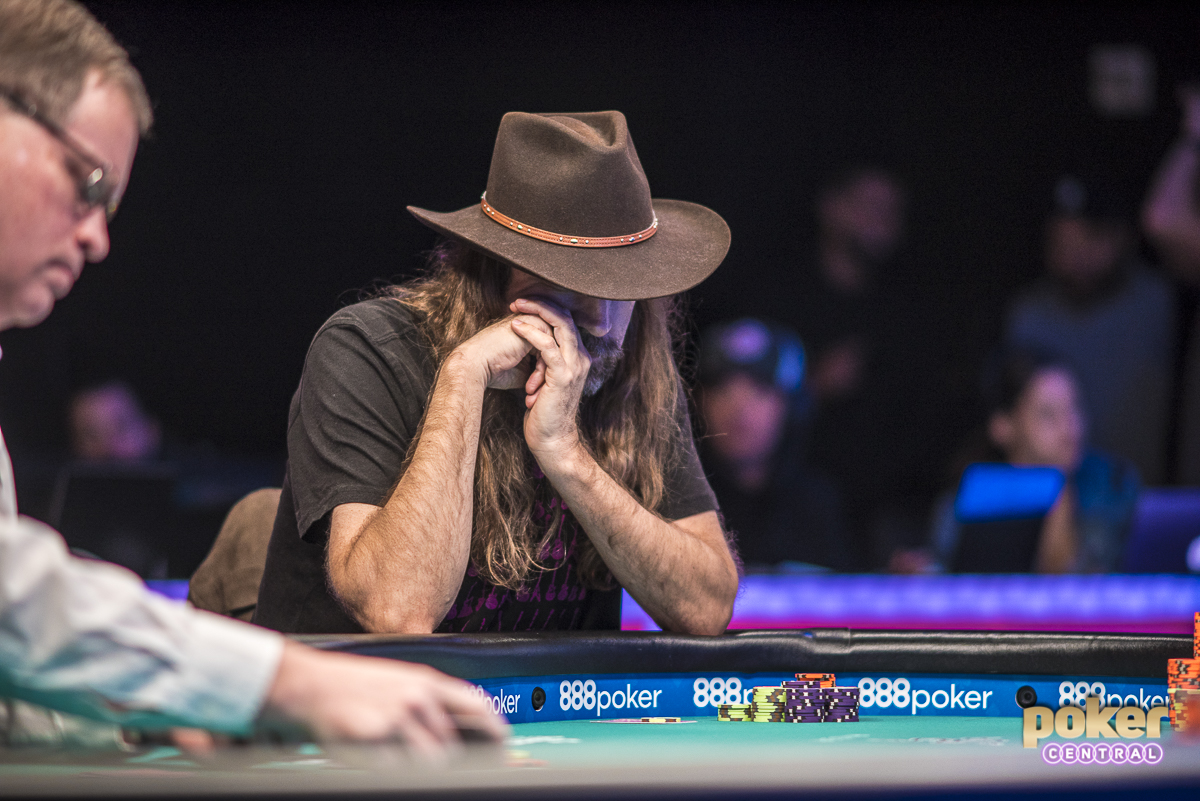
The oversight in choosing this formula became painfully clear when it wasn’t a familiar face such as Jason Mercier of Ben Lamb going on a 20-cash rampage in low buy-in events but the much-maligned Chris ‘Jesus’ Ferguson. Once again, Ferguson is not to blame for sneaking into the money numerous times resulting in 23 cashes of which three were final table finishes, resulting in one bracelet win in the €1,650 Pot Limit Omaha tournament at the World Series of Poker Europe in Rozvadov where he beat a field of 92 players to win his sixth-career bracelet.
Ferguson’s results in 2017 WSOP events totaled $428,423, which put him 80th on that year’s WSOP Money List. While consistency and results in low buy-in events always deserve praise, looking back on the 2017 Player of the Year standings it’s hard to pick memorable moments from the players that finished in the Top 10, because just four of them won bracelets, and the only players that cashed for more than seven-figures on this list did so in the High Roller for One Drop where he, Dario Sammartino, finished in third place.
| 2017 World Series of Poker Player of the Year Standings | ||||||
| Name | Cashes | Final Tables | Wins | Winnings | Points | |
| 1 | Chris Ferguson | 23 | 3 | 1 | $428,423 | 1,178.53 |
| 2 | John Racener | 21 | 2 | 1 | $375,708 | 1,042.04 |
| 3 | Ryan Hughes | 19 | 3 | 0 | $252,478 | 994.35 |
| 4 | Mike Leah | 20 | 1 | 0 | $128,807 | 910.01 |
| 5 | John Monnette | 14 | 4 | 1 | $479,418 | 865.21 |
| 6 | Kenny Hallaert | 11 | 2 | 0 | $766,937 | 838.35 |
| 7 | Alex Foxen | 16 | 2 | 0 | $197,577 | 833.45 |
| 8 | Dario Sammartino | 9 | 2 | 0 | $2,164,217 | 775.89 |
| 9 | Raymond Henson | 12 | 4 | 0 | $295,295 | 768.49 |
| 10 | Ben Yu | 12 | 2 | 1 | $463,801 | 766.49 |
The 2017 POY system heavily valued getting results of any kind, which is directly reflecting in each of the top four players cashing 19 or more times. Between the top-four, just two bracelets were won, and nine total final tables. The only two players that were consistent enough to finish in the Top 10 both in 2017 and 2018 were Ben Yu and Mike Leah, but looking at Deeb’s numbers alone makes it very clear that smaller results were valued far too high in the 2017 formula.
Putting Deeb’s Numbers Into Perspective
The 2017 WSOP campaign of Shaun Deeb was by no means spectacular, but he did cash in 10 events, making two final tables, his best result being a runner-up finish in the $10,000 Limit 2-7 Triple Draw Championship for $143,842. Using the 2017 formula, Deeb gathered 602.7 points, good for 23rd place on that year’s standings.
If we recalculate Deeb’s results from 2017 using the 2018 formula, Deeb gathers 2,556 points and that puts him seventh on the 2018 rankings with $394,497 in total earnings that year at the WSOP. While in a way it’s apples and oranges, that amount cashed for along with the total results and his two final tables made would turn this into a comparable summer to that of the seven through tenth-placed players this year.
The contrast with recalculating Chris Ferguson’s 2017 with the 2018 formula could not be much bigger, as, after removing the World Series of Poker Europe results, ‘Jesus’ would only be placed 13th on the current standings. Even after adding his results from the Czech Republic, where he won the only bracelet of his POY campaign, Ferguson would barely crack the current Top 10 with this year’s WSOP-E still to come.
| Comparing the POY Top 10 of 2017 vs 2018 | ||||
| Cashes | Final tables | Bracelets | Winnings | |
| 2017 | 157 | 25 | 4 | $5,552,661 |
| 2018 | 117 | 30 | 9 | $13,498,051 |
The 2018 Formula and its Results
After having already established that a place among the Top 10 in 2017 was almost purely volume based, it still doesn’t make looking at the Top 10 of 2018 any easier. The entire top four of the current 2018 standings has cashed for more than seven-figures, and Paul Volpe in sixth place also has $1.3 million in winnings to show for. The entire Top 7 took home a bracelet while two players won multiple bracelets, Deeb and Cada.
Despite bigger results in bigger events are valued better, it’s good to see that one big result doesn’t skew the ranks. Joe Cada was the only player in the Top 10 to boast a WSOP Main Event final table run, adding to his overall earnings significantly. Without his fifth-place finish in the WSOP Main Event, however, Cada would’ve still been sixth on the current 2018 Player of the Year standings. None of the Big One for One Drop players even cracked the Top 100 of the Player of the Year race, and from the Main Event final table John Cynn is the highest ranked player in 26th place and the only other player from that group to crack the Top 100.
| 2018 World Series of Poker Player of the Year Standings | ||||||
| Name | Cashes | Final Tables | Wins | Winnings | Points | |
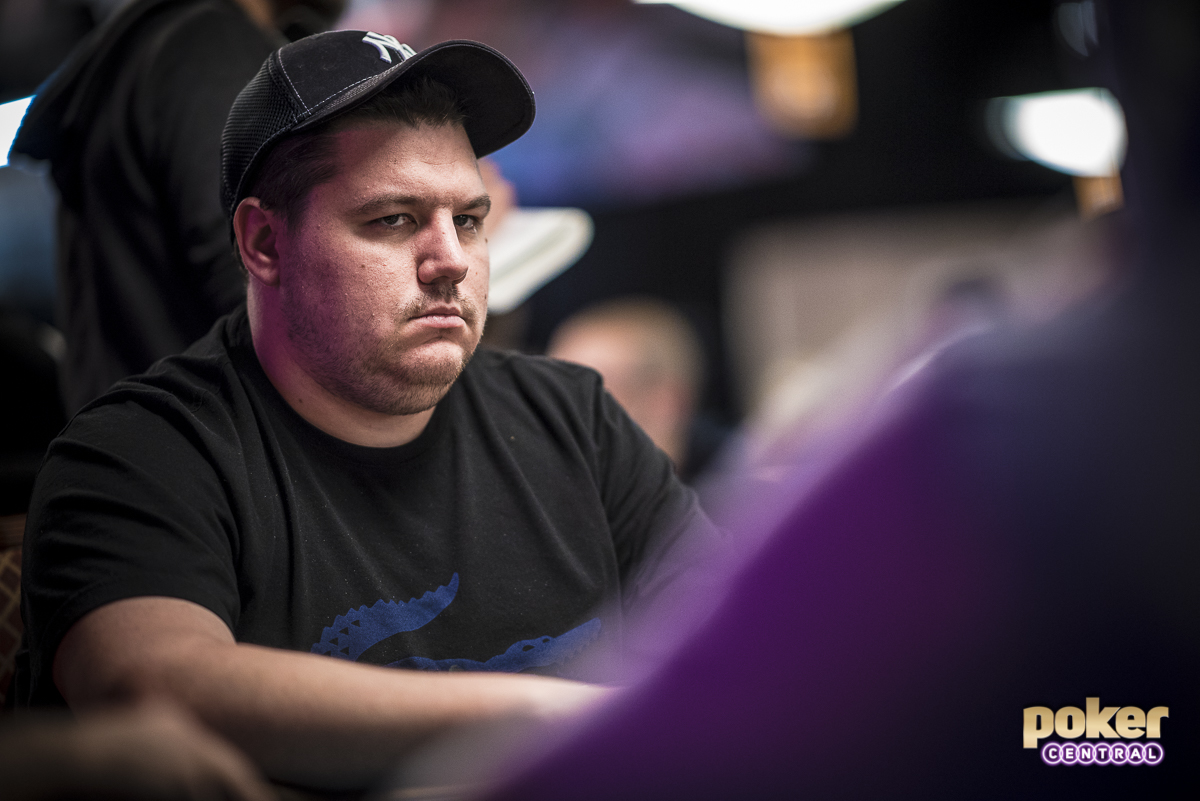
| 1 | Shaun Deeb | 16 | 3 | 2 | $2,461,398 | 4,334.06 |
| 2 | Ben Yu | 15 | 4 | 1 | $2,781,467 | 3,746.04 |
| 3 | Joe Cada | 7 | 4 | 2 | $3,025,439 | 3,531.86 |
| 4 | John Hennigan | 12 | 4 | 1 | $1,320,566 | 3,499.91 |
| 5 | Scott Bohlman | 12 | 4 | 1 | $739,858 | 3,155.88 |
| 6 | Paul Volpe | 8 | 3 | 1 | $1,379,499 | 2,859.76 |
| 7 | Eric Baldwin | 12 | 1 | 1 | $378,705 | 2,516.30 |
| 8 | Justin Liberto | 13 | 2 | 0 | $429,526 | 2,459.84 |
| 9 | Mike Leah | 10 | 3 | 0 | $655,766 | 2,354.13 |
| 10 | Anthony Zinno | 12 | 2 | 0 | $325,827 | 2,330.37 |
Aside from the fact that Deeb had a stellar summer in 2018, his numbers become even more impressive when calculating them through the old formula. If Shaun Deeb had collected the results he did these past two months in 2017, he’d been second on that leaderboard with 1,135.92 points while still having the WSOPE to look forward to. When subtracting Ferguson’s results from WSOPE in 2017, Deeb would’ve been ahead of him after wrapping up the Las Vegas portion of the race. This, however, doesn’t validate the 2017 POY formula, as Deeb’s summer has almost no comparison, even when looking at some historical perspective. Keep in mind that both Ben Lamb and Greg Merson had huge Main Event scores to add to their success in 2011 and 2012.
| Year | Winner | Bracelets | Final Tables | Cashes | Earnings |
| 2004 | Daniel Negreanu | 1 | 5 | 6 | $346,280 |
| 2005 | Allen Cunningham | 1 | 4 | 5 | $1,007,115 |
| 2006 | Jeff Madsen | 2 | 4 | 4 | $1,467,852 |
| 2007 | Tom Schneider | 2 | 3 | 3 | $416,829 |
| 2008 | Erick Lindgren | 1 | 3 | 5 | $1,348,528 |
| 2009 | Jeff Lisandro | 3 | 4 | 6 | $807,521 |
| 2010 | Frank Kassela | 2 | 3 | 6 | $1,255,314 |
| 2011 | Ben Lamb | 1 | 4 | 5 | $5,352,970 |
| 2012 | Greg Merson | 2 | 2 | 5 | $9,785,354 |
| 2013 | Daniel Negreanu | 2 | 4 | 10 | $1,954,054 |
| 2014 | George Danzer | 3 | 5 | 10 | $878,933 |
| 2015 | Mike Gorodinsky | 1 | 3 | 8 | $1,766,487 |
| 2016 | Jason Mercier | 2 | 4 | 11 | $960,424 |
| 2017 | Chris Ferguson | 1 | 3 | 23 | $428,423 |
| 2018 | Shaun Deeb | 2 | 3 | 16 | $2,461,398 |
A caveat must be inserted here, as the amount of WSOP events has increased significantly to 78 since 2004 (32 events), and since 2016 a friendlier 15% of the field gets paid out versus 10% in all years prior. You might say that 2018 players heavily outperformed their 2017 counterparts, and while it would be an enormous undertaking to recalculate all players’ results, there are some direct comparisons that favor the opposite in a non-scientifical way.
Comparing the 2017 and 2018 WSOP Money List, shows that the 30th-place finishers on that list year-over-year are only $7,000 apart. The year 2018 had 28 players that cashed for $1,000,000 or more, while 2017 had 25 such players. This difference is directly explained by five players finishing in-the-money during the Big One for One Drop.
Controlling for Big One for One Drop results, the Top 30 from 2017 cashed for a total of $60.6 million versus $61.2 million in 2018. Comparing this arbitrary statistic place-by-place, the Top 30 from 2017 outearned this year’s Top 30 in 21 spots, but only twice in the top 11. Take those numbers for what they are, but it’s interesting to see them side by side.
Deeb vs Ferguson
To summarize the overwhelming amount of numbers and names, Shaun Deeb’s 2018 was far more impressive than Chris Ferguson’s 2017, but in a few years time, we’ll just see them as two winners of the WSOP Player of the Year race. Adding more context to Ferguson’s crazy string of cashes, his 2018 would’ve put him sixth on the 2017 standings despite a large majority of min-cashes, just two final tables, and zero wins.
| Shaun Deeb at the World Series of Poker | ||||||
| Year | Cashes | Final Tables | Wins | Winnings | Points | POY Rank |
| 2017 | 10 | 2 | 0 | $394,497 | 602.7 | 23 |
| 2018 | 16 | 3 | 2 | $2,461,398 | 4,334.1 | 1 |
| Chris ‘Jesus’ Ferguson at the World Series of Poker | ||||||
| Year | Cashes | Final Tables | Wins | Winnings | Points | |
| 2017 | 23 | 3 | 1 | $428,423 | 1,178.5 | 19 |
| 2018 | 17 | 2 | 0 | $253,628 | 1,853.0 | 1 |
Looking forward, I think the WSOP did an excellent job admitting through change that the 2017 formula was filled with flaws and that the 2018 math works a lot better to determine the Player of the Year. For the historic significance of a list like this that only true poker fans and die-hard players care about, I think it’s important that this has been improved upon.
Lastly, while it feels as though there’s no way Shaun Deeb will lose his lead in this Player of the Year race, if Ben Yu, Joe Cada, or John Hennigan were able to overtake him in Rozvadov, we might need to write another chapter crowing that player ‘the most successful WSOP Player of the Year ever’ but until then I think it’s safe to throw more fuel on the fire and celebrate the 2018 WSOP campaign of Shaun Deeb, and quickly forget about the ever-lasting association Chris Ferguson has with the 2017 WSOP.
Relive the 2018 World Series of Poker on PokerGO with more than 20 on-demand action final tables and Main Event coverage. Subscribe to PokerGO right now and enjoy more than 100 days of live poker action every single year on top of an extensive on-demand library. All calculations for this article were done using the 2017 and 2018 POY calculators provided by the World Series of Poker.
Related Articles